
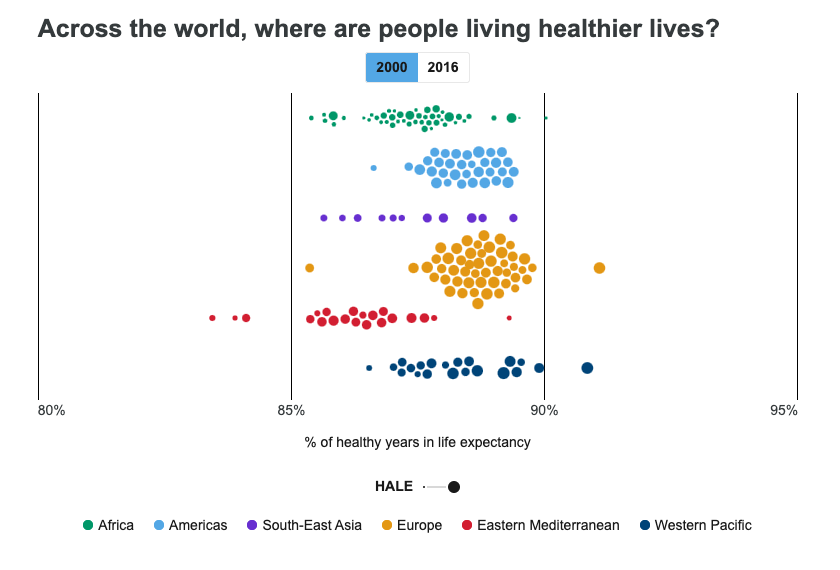
Each bubble in the graph above represents a country within its larger regional cluster. The bubbles that appear closer to the right signify that a greater portion of life is lived in good health. The size of the bubble denotes a longer and healthier life expectancy.
The data indicates significant progress made in increasing Health Adjusted Life Expectancy (HALE) across the world. Yet, the disparities are obvious—both by region as well as the size of the bubbles and their relative position.
For example, a small bubble to the right may imply the country is in a good position. But it also means that the average healthy life may not be long. Similarly, a country to the left with a large bubble indicates that while HALE is low, the number of healthy years could be larger.
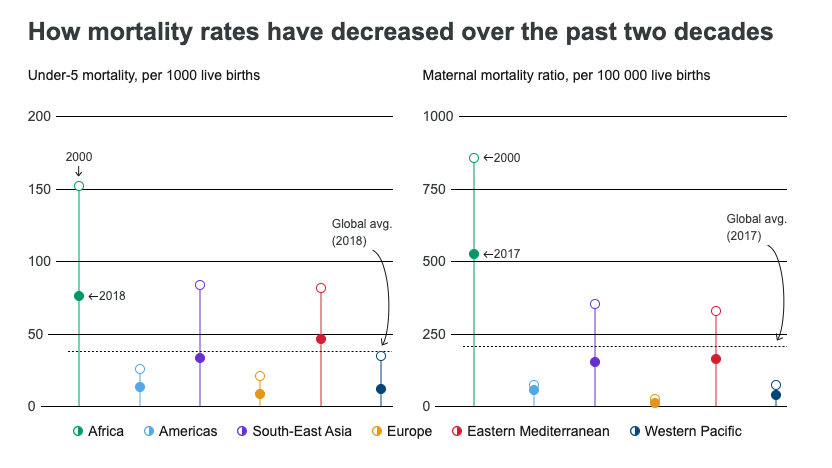
The charts above indicate major improvement in both under-5 mortality and maternal mortality—progress that is generally attributed to the Millennium Development Goals (MDGs).
The risk of a child dying before the age of five has halved in the African region over the past two decades owing largely to greater access to vaccination for various diseases. The following vaccinations have been particularly critical in achieving success:
- From 2000-18, global immunization coverage of DTP 3 (Diphtheria-tetanus-pertussis) increased from 72% to 85%
- From 2000-18, global immunization coverage of MCV2 (Measles-containing-vaccine second dose) increased from 18% to 69%
- From 2008-18, global immunization coverage of PCV3 (Pneumococcal conjugate 3rd dose) increased from 4% to 47%.
Of particular concern is the under-5 mortality rate in Africa which, as of 2018, is 8 times higher than that of the European region. To achieve the 2030 goal of reducing under-5 mortality to as low as 25 per 1000 live births requires significant effort.
In comparison, most maternal deaths are preventable and are indicative of inequalities in accessing quality health care. The 2030 goal aims to reduce the global maternal mortality ratio to less than 70 deaths per 100,000 live births. Africa’s current ratio is 525 maternal deaths per 100,000 live births—more than seven times greater than the target.International Health Regulations
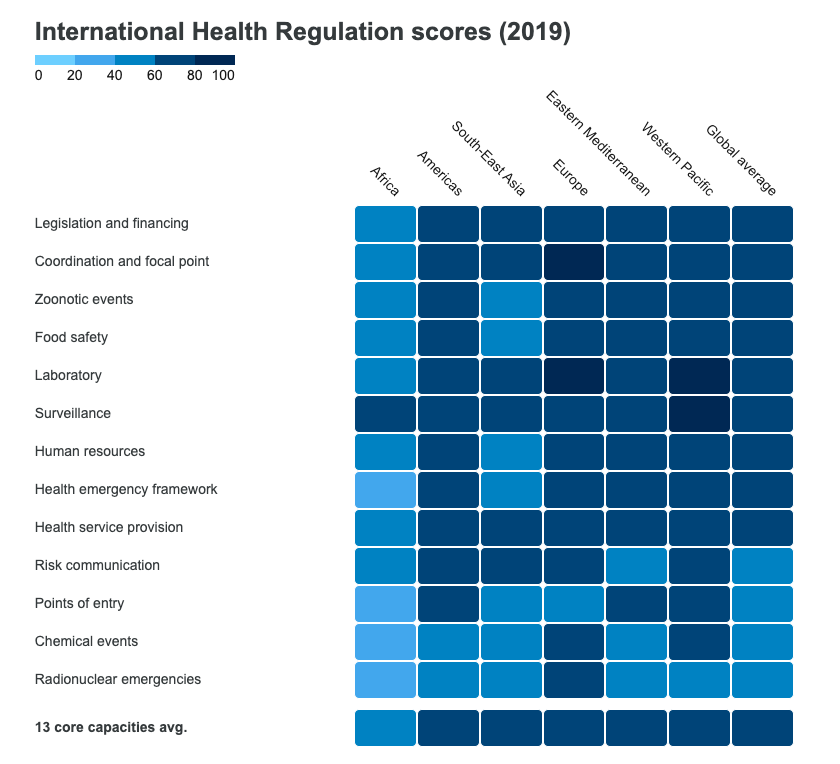
The International Health Regulations (IHR) (2005), an agreement between 196 countries, represents a consolidated effort to achieve global health security through developing and improving public health capacities that allow for successfully managing public health emergencies. The IHR scoring system measures a country’s overall resilience towards such health-related crisis by evaluating their ability to prepare for, and respond to, health emergencies.
The data presented below is reported by countries on 13 core capacities that encompass, for example, measures taken at ports, airports, and ground crossings to limit the spread of health risks.
Source: https://www.who.int/data/gho/whs-2020-visual-summary